Our 2019 Transition to Teaching survey confirms the decade-long teacher surplus in Ontario is over, with new teachers once again in high demand.
Early-career teachers report very low unemployment rates. As well, many regions of the province are experiencing shortages of French first-language teachers and French as a Second Language (FSL) teachers.
First-year English-language teacher unemployment rates fell to seven per cent. Precarious contract terms persist for years, however, for many teachers working in English-language district school boards who do not hold FSL credentials.
Teacher shortages are expected over the next several years that could reach well beyond the already challenging French-language shortages of the past few years.
At the secondary level, timing of future shortages in teaching subjects other than math and sciences will depend on the impact on teaching position reductions arising from class size and e-learning policy implementation.
Unemployment Rates for English-Language Teachers
The unemployment rate for primary-junior English-language teachers was 9% in 2019, 10% in 2018 and 19% in 2017.
The unemployment rate for junior-intermediate (math or science) English-language teachers in 2019 and 2018 was 0% and was 21% in 2017.
The unemployment rate for junior-intermediate (excluding math and science) English-language teachers was 7% in 2019, 11% in 2018, and 37% in 2017.
The unemployment rate for intermediate-senior (math, science) English-language teachers was 4% in 2019, 6% in 2018, and 11% in 2017.
The unemployment rate for intermediate-senior (excluding math, science) English-language teachers was 8% in 2019 and 2018, and 23% in 2017.
Annual New and Annual Retiring Teachers
From 2016 to 2014 there were an annual average of 11,496 new teachers and 4,612 retiring teachers, for a difference of 6,884 each year.
From 2015 to 2018 there were an annual average of 6,802 new teachers and 4,904 retiring teachers, for a difference of 1,898 each year.
The forecast for 2019 to 2022 is for an annual average of 5,950 new teachers and 5,250 retiring teachers each year, for a difference of 700 each year.
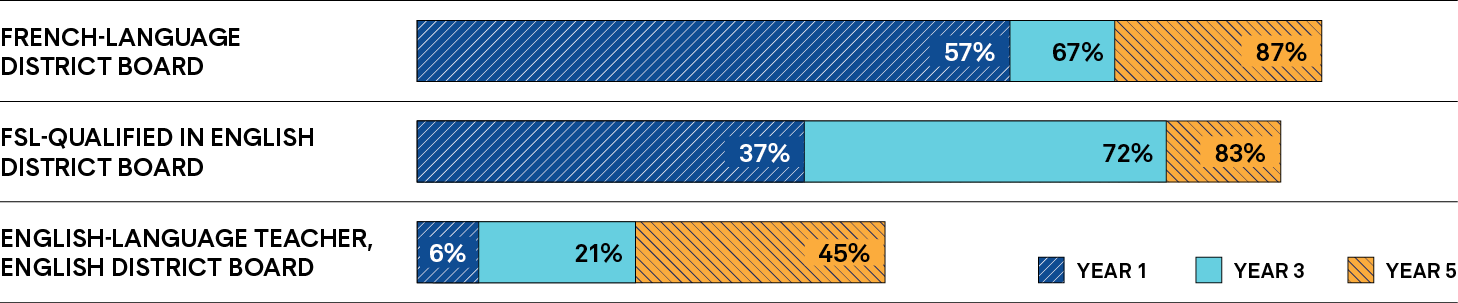
Early-Career Teachers with Permanent Contracts
Of first-year teachers working with French-language district boards, 57% had permanent contracts. Of those with FSL qualifications working in English district boards, 37% had permanent contracts. And for those first-year English-language teachers at English district boards, 6% had permanent contracts.
Of third-year teachers working with French-language district boards, 67% had permanent contracts. Of those with FSL qualifications working in English district boards, 72% had permanent contracts. And for those third-year English-language teachers at English district boards, 21% had permanent contracts.
Of fifth-year teachers working with French-language district boards, 87% had permanent contracts. Of those with FSL qualifications working in English district boards, 83% had permanent contracts. And for those fifth-year English-language teachers at English district boards, 45% had permanent contracts.
Unemployment Rate for First-Year Teachers
For first-year teachers of primary-junior grades, unemployment in 2017 was 16%, 7% in 2018 and 6% in 2019.
For first-year teachers of junior-intermediate grades, unemployment in 2017 was 17%, 6% in 2018 and 3% in 2019.
For first-year teachers of intermediate-senior grades, unemployment in 2017 was 15%, 5% in 2018 and 4% in 2019.
For first-year technological teachers, unemployment in 2017 was 15%, 0% in 2018 and 0% in 2019.
Employers of First-Year Ontario Graduates in 2019: All Employment, Including Daily Occasional Roster
For all first-year Ontario graduates, including those on the daily occasional roster, Ontario English district school boards accounted for 77.3% of employment, Ontario French district school boards accounted for 8.7%, placement outside of the province accounted for 6.4%, Ontario independent schools accounted for 6%, First Nations schools accounted for 1.3% and school authority/section 68 accounted for 0.3%.
Employers of First-Year Ontario Graduates in 2019: Permanent Contracts Only
For all first year Ontario graduates with permanent contracts, Ontario English district school boards accounted for 47.9% of employment, Ontario French district school boards accounted for 21.3%, placement outside of the province accounted for 14.8%, Ontario independent schools accounted for 11.8%, and First Nations schools accounted for 4.1%.
Employment Frequency of Ontario-Resident First-Year Daily Occasional Teachers
In 2016, 32% of first-year teachers surveyed reported working four to five days per week. 32% worked three to four days per week. 17% worked two to three days per week. 14% worked one to two days per week. 3% worked fewer than one day per week. And 2% were on the roster with no assignments.
In 2017, 55% of first-year teachers surveyed reported working four to five days per week. 21% worked three to four days per week. 15% worked two to three days per week. 6% worked one to two days per week. 2% worked fewer than one day per week. And 1% were on the roster with no assignments.
In 2018, 62% of first-year teachers surveyed reported working four to five days per week. 22% worked three to four days per week. 10% worked two to three days per week. 6% worked one to two days per week. 0% worked fewer than one day per week. And 1% were on the roster with no assignments.
In 2019, 57% of first-year teachers surveyed reported working four to five days per week. 28% worked three to four days per week. 8% worked two to three days per week. 4% worked one to two days per week. 2% worked fewer than one day per week. And 1% were on the roster with no assignments.
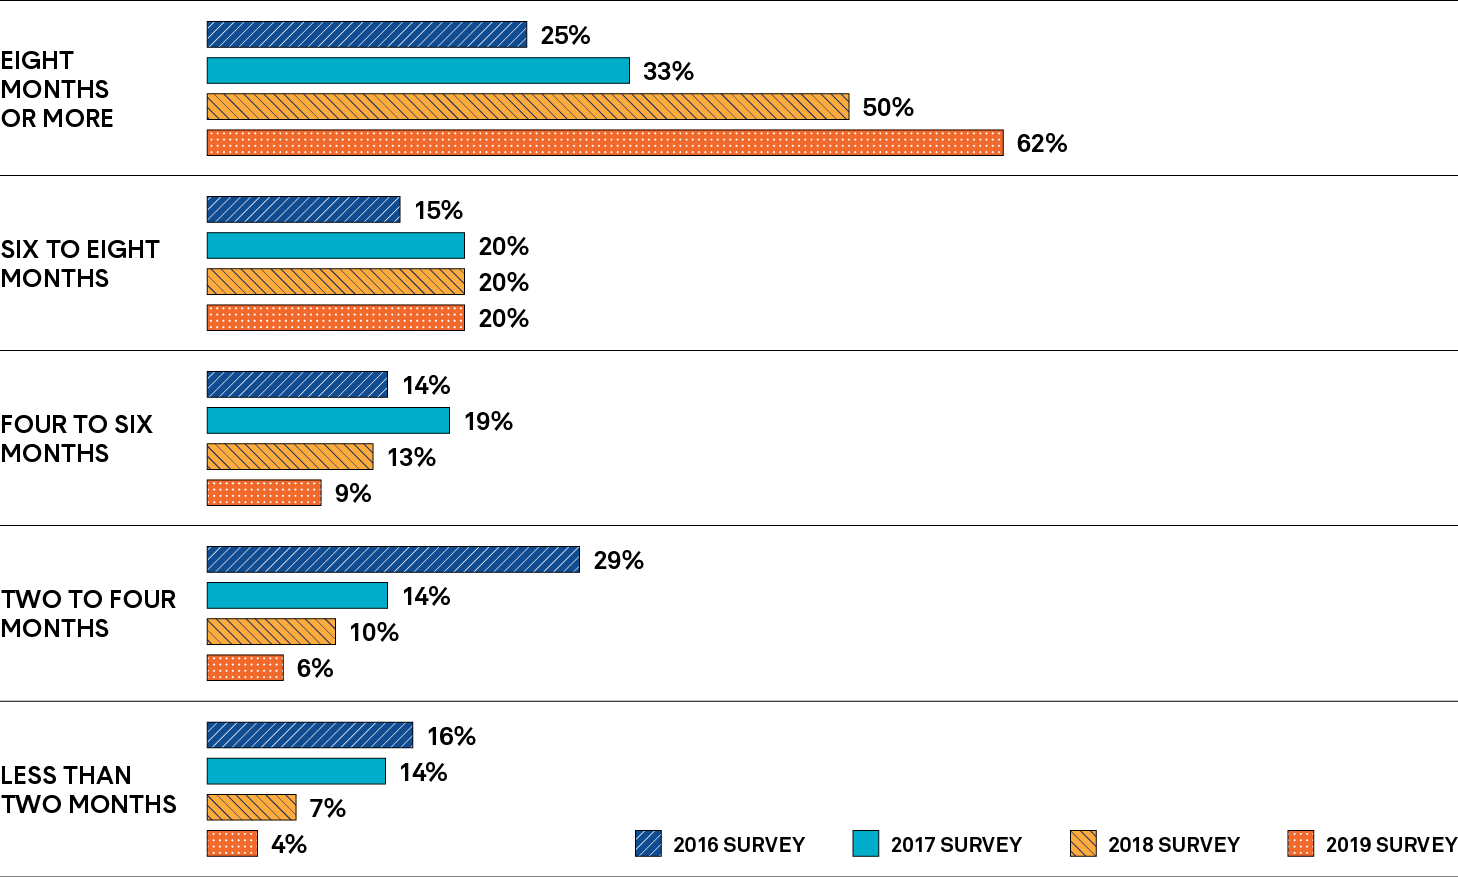
Duration of Daily Occasional Teaching for Ontario-Resident First-Year Teachers
In 2016, 25% of Ontario-resident first-year teachers who engaged in daily occasion work did so for eight months or more. 15% worked daily occasional for six to eight months, 14% for four to six months, 29% for two to four months, and 16% for less than two months.
In 2017, 33% of Ontario-resident first-year teachers who engaged in daily occasion work did so for eight months or more. 20% worked daily occasional for six to eight months, 19% for four to six months, 14% for two to four months, and 14% for less than two months.
In 2018, 50% of Ontario-resident first-year teachers who engaged in daily occasion work did so for eight months or more. 20% worked daily occasional for six to eight months, 13% for four to six months, 10% for two to four months, and 7% for less than two months.
In 2016, 62% of Ontario-resident first-year teachers who engaged in daily occasion work did so for eight months or more. 20% worked daily occasional for six to eight months, 9% for four to six months, 6% for two to four months, and 16% for less than two months.