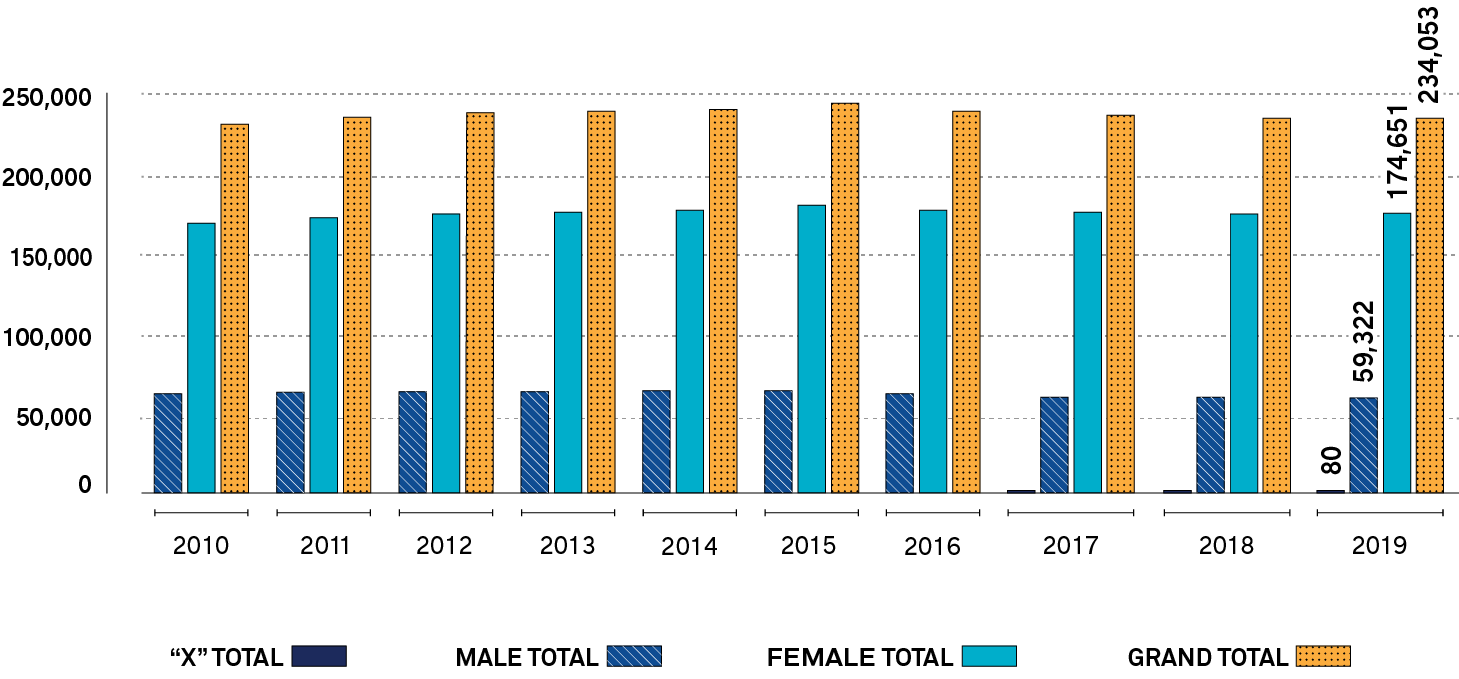
"X" is a third gender identifier for use by people identifying as Trans, Non-Binary, Two Spirited or Binary, as well as anyone who chooses not to display their gender identity.
In 2010, 168,293 female members and 61,829 male members. Grand total: 230,122.
In 2011, 171,641 female members and 62,775 male members. Grand total: 234,416.
In 2012, 174,094 female members and 63,155 male members. Grand total: 237,249.
In 2013, 175,184 female members and 63,017 male members. Grand total: 238,201.
In 2014, 176,397 female members and 62,959 male members. Grand total: 239,356.
In 2015, 179,531 female members and 63,673 male members. Grand total: 243,204.
In 2016, 176,346 female members and 61,797 male members. Grand total: 238,143.
In 2017, 175,019 female members, 60,683 male members and 3 X. Grand total: 235,705.
In 2018, 174,017 female members, 59,730 male members and 40 X. Grand total: 233,787.
In 2019, 174,651 female members, 59,322 male members and 80 X. Grand total: 234,053.
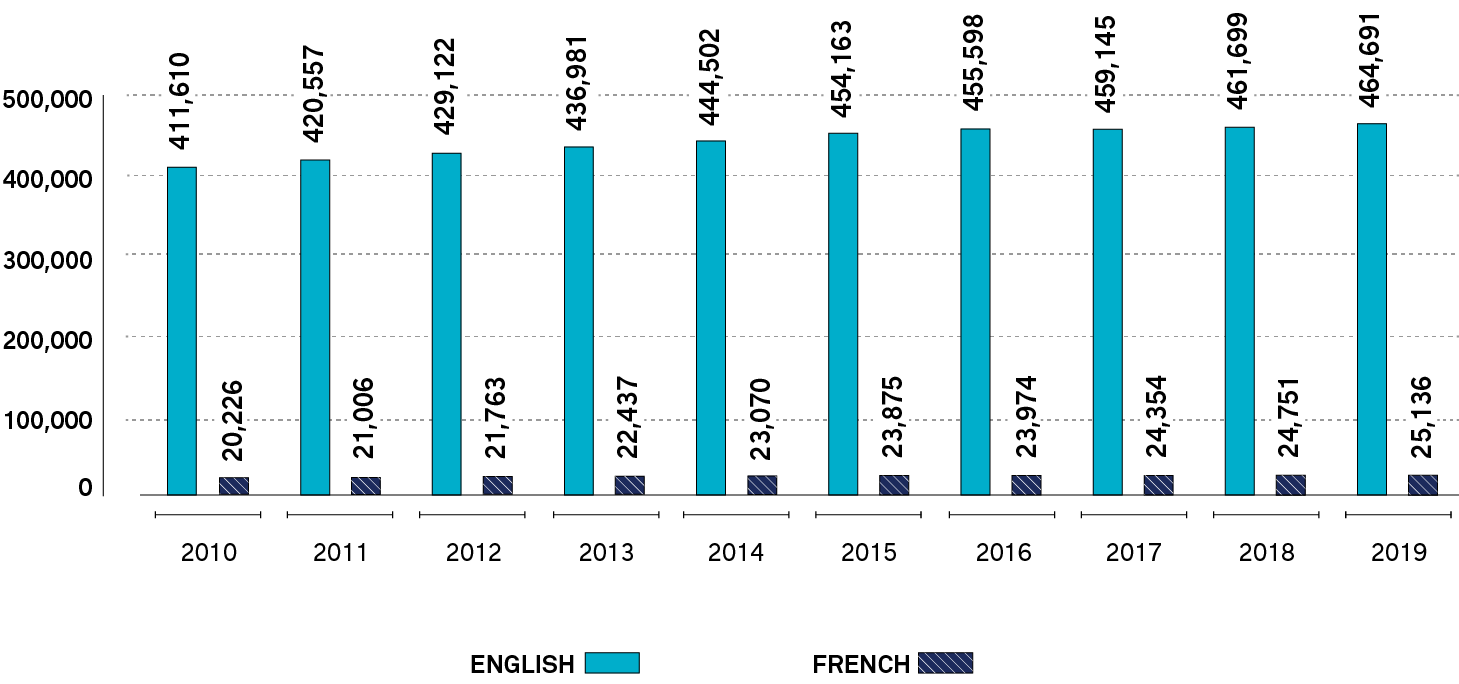
In 2010, 411,610 English and 20,226 French.
In 2011, 420,557 English and 21,006 French.
In 2012, 429,122 English and 21,763 French.
In 2013, 436,981 English and 22,437 French.
In 2014, 444,502 English and 23,070 French.
In 2015, 454,163 English and 23,875 French.
In 2016, 455,598 English and 23,974 French.
In 2017, 459,145 English and 24,354 French.
In 2018, 461,699 English and 24,751 French.
In 2019, 464,691 English and 25,136 French.
Southcentral Ontario: 82,674.
Central Ontario: 70,028.
Southwest Ontario: 30,201.
Southeast Ontario: 29,305.
Northwest Ontario: 7,985.
Northeast Ontario: 6,416.
Total: 226,657
English Public Boards: 97,779.
Member Paid for Self: 82,881.
English Catholic Boards: 40,678.
French Catholic Boards: 6,649.
Independent Schools: 2,975.
French Public Boards: 2,829.
Other Education Organizations: 262.
Grand Total: 234,053.